Say no to slow performance. Learn how to improve your website speed with Core Web Vitals (INP, LCP, CLS) across platforms like WordPress, Shopify, and React/Next.js.
Key Takeaways:
1. How do I increase my website speed?
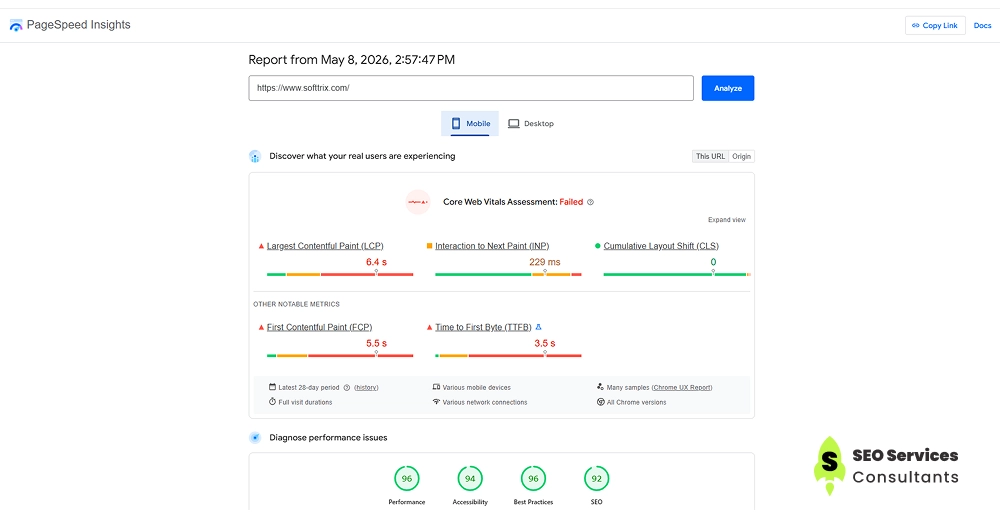
Improving website speed is crucial for your website’s performance. Before developing any strategies, it’s important to start with a proper diagnosis using tools like Google PageSpeed Insights or GTmetrix. These tools help you identify the exact issues that slow down your website. Most issues are common, like large image sizes, browser caching problems, large CSS files, unused plugins, and third-party tools. You can address high-impact issues by compressing images into WebP or AVIF, using a CDN, and minifying files like CSS, JavaScript, and HTML. Remove plugins and tools that are no longer in use. More importantly, fix Core Web Vitals issues like slow-loading elements and layout shifts. After fixing these, your website speed can improve by 70–90%. If your site is still slow, then a professional agency or SEO consultants se can help you further.
2. How fast should my website actually be?
Ideally, your website should load in 2 to 3 seconds. This helps provide a better user experience and reduces bounce rates. But more important than total load time are the metrics defined in Google Core Web Vitals. You should focus on Largest Contentful Paint (LCP) under 2.5 seconds, First Input Delay (FID) under 100 ms, and Cumulative Layout Shift (CLS) close to 0. These metrics directly impact user experience and search rankings.
3. Can improving website speed really increase leads or sales?
Yes. Speed directly affects user behavior. A faster website keeps users engaged, builds trust, and improves conversions.
Focus on key areas like faster landing page loading, better mobile performance, and reducing delays in forms and checkout processes. Even small improvements can lead to noticeable growth in conversions.
Website speed is not just a feature. It directly impacts your sales and revenue.
According to Akamai Technologies, conversions drop by 7% for every second of delay. On the other hand, reducing load time from 5 seconds to 2 seconds can increase conversions by up to 74%.
Data from Google shows that 53% of mobile users abandon a page if it takes more than 3 seconds to load.
A slow website does not just frustrate visitors. It actively costs you rankings, revenue, and potential customers.
In this guide, we cover practical techniques, tools, and fixes to improve your site speed. More importantly, you will also find advanced tactics that most guides do not talk about.
The result is a better user experience, improved SEO rankings, higher conversions, and lower bounce rates.
Why Website Speed Matters More Than Ever in 2026
Most articles hide the real business impact in a footnote. Let’s start with it – because if you don’t feel urgency, you won’t take it seriously.
You can change strategies. You can rank on the first page. But if your website is slow, visitors will leave before they even see what you offer.
Amazon found that every 100 milliseconds of delay costs them 1% in sales. For a $10M/year e-commerce business, that’s $100,000 lost for every 100 ms. That’s not a small leak; it’s a silent revenue drain.
If you want to understand your own numbers:
Take your monthly visitor count. Multiply it by your conversion rate and average order value. Then apply a 7% drop for every extra second your site takes to load.
That final number? That’s the revenue you’re currently leaving on the table.
What does fast actually mean in 2026?
Almost every time, you hear that your website speed should be fast -but how fast? No one clearly explains it. Here, we break it down using Core Web Vitals, which define measurable benchmarks for performance. These metrics directly impact your ranking signals. In March 2024, Google replaced the old First Input Delay (FID) with Interaction to Next Paint (INP). This new metric is a much stricter way to measure interactivity, and many guides still haven’t caught up with it.
LCP. Loading
< 2.5s
Largest Contentful Paint. How long before the main content appears?
Good: <2.5s. Need word: 2.5-4s. Poor: >4s
INP. Interactivity
<200ms
Interaction with the next paint. Measure to a;; user interactions, not just the first.
Replaced FID in 2024. Good < 200 ms. Poor: >500ms
CLS. Stability
<0.1
Cumulative layout shift. Measures visual stability – how much the page jumps around as it loads. Good: <0.1. Poor: >0.25
Why INP matters more than people realize
FID only measured the delay before the browser starts processing the first interaction. INP measures the full duration of every interaction throughout the session – including clicks, taps, and keyboard inputs. A page where buttons feel sluggish will fail INP even if its FID was perfect. This disproportionately affects single-page applications, dashboards, and any site with complex client-side JavaScript.
TTFB. Server Response
< 0.8s
Time to First Byte. How fast your server responds when a user requests the page.
Good: <0.8s. Needs work: 0.8–1.8s. Poor: >1.8s
FCP. First Paint
< 1.8s
First Contentful Paint. When the first visible content (text or image) appears on screen.
Good: <1.8s. Needs work: 1.8–3s. Poor: >3s
TBT. Blocking Time
< 200ms
Total Blocking Time. Measures how long the browser is blocked and cannot respond to user input.
Good: <200ms. Needs work: 200–600ms. Poor: >600ms
Speed Index. Visual Loading
< 3.4s
Shows how quickly the page content is visually displayed during loading.
Good: <3.4s. Needs work: 3.4–5.8s. Poor: >5.8s
Diagnose before you fix: run these 5 tests
When you search for website speed, you will get the answer. Just optimize the image and use CDN. Definitely, these are useless tips; you don’t specify what the bottleneck is. Before touching a single file, run these diagnostic steps and record your baseline scores. These are the starting points that showcase your improvement.
| Tool | Data Type | What It Uniquely Tells You |
|---|---|---|
| Google PageSpeed Insights | Field + Lab | Real user data from the CrUX dataset — actual performance on real devices, not just lab simulations. Also shows Core Web Vitals status. |
| GTmetrix | Lab (Synthetic) | Waterfall charts, detailed request timing, and Lighthouse scores. Great for debugging specific resources. |
| WebPageTest | Lab (Multi-location) | Tests performance from different geographic locations and connection speeds. Useful for analyzing global audience experience. |
| Chrome DevTools Network | Lab | The most detailed waterfall analysis available. Shows every resource, file size, loading order, and blocking requests. |
| Google Search Console CWV | Field (28-day Average) | Shows which pages are failing Core Web Vitals based on real user data. Directly reflects potential Google ranking impact. |
The distinction no one explains
PageSpeed Insights is a free tool by Google that analyzes your website’s performance, speed, and user experience.
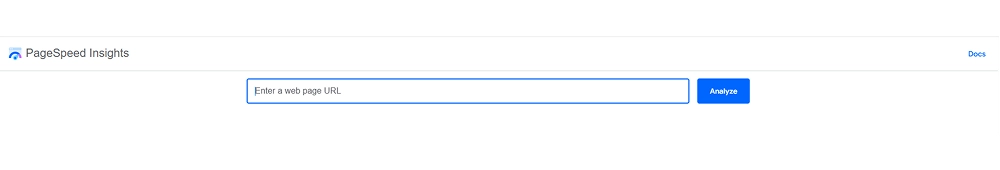
It provides two types of data:
Field data (from real Chrome users via the CrUX dataset)
Lab data (from a simulated Lighthouse test)
If these two don’t match, rely on field data, because it reflects real user experience and what Google actually considers for ranking.
Lab data is mainly for debugging and identifying issues.
If your score is low, start by checking your Core Web Vitals in the field data, then use lab data to fix the problems.
Your baseline scorecard
Before making any changes, record these seven numbers. Write them down. You’ll use them to measure every improvement:
- LCP score (in seconds) from PageSpeed Insights
- INP score (in milliseconds) from PageSpeed Insights
- CLS score from PageSpeed Insights
- TTFB (Time to First Byte) from WebPageTest
- Total page weight in KB/MB from GTmetrix
- Total number of HTTP requests from GTmetrix
- Core Web Vitals status from Google Search Console (Passing / Failing)
Check out how website speed can be optimized
Before fixing anything, you need to understand what’s actually slowing your site down. Most businesses jump straight to “optimization” without diagnosing the real issue, and that’s where things go wrong.
Let’s break down the common problems and what you can realistically do to fix them:
1. Foundation Layer: Hosting, Server, and Infrastructure
Hosting is the foundation of your website speed. Your performance heavily depends on it. Even a well-optimized site will feel slow if the server is weak.
This is often the biggest missed opportunity because changing hosting feels difficult. But in reality, it can improve your speed instantly without any coding.
Choosing the Right Hosting
- Shared hosting - Only for small websites with low traffic (< 1000 visitors/month). Not suitable whether your website generates leads or sales.
- VPS( Virtual Private Sector) - A good middle option. Better speed and more control than shared hosting.
- Managed cloud hosting - Providers like Kinsta, WP Engine, and Cloudways handle performance for you. Best for business websites.
- Edge hosting - Platforms like Vercel, Netlify, and Cloudflare Pages load your site from servers close to users. This makes your site extremely fast worldwide.
Important Speed Metric: TTFB (Time to First Byte)
Good: under 800 ms
Excellent: under 200 ms
If your website feels slow, this is usually the reason
3 Common Causes of Slow Speed
No caching – Your site reloads everything every time. Caching can make it much faster.
Slow server location – If your server is far from your users, your site loads more slowly.
Heavy database or backend – Too much processing on the server slows everything down.
Simple Fix That Most People Miss
Enable HTTP/3 and Quic
HTTP/3 is now widely supported across all major browsers and CDNs in 2026. Http/3 uses the QUIC transport protocol instead of TCP. It improves speed, especially on mobile networks. Many hosting providers and Cloudflare already support it.
What You Get After Fixing This Layer
Faster website load time
Better user experience
Higher conversions
Lower bounce rate
2. Image Optimization: The Biggest Speed Win
Most of your page weight comes from images. In many cases, they account for 50 to 80% of your total page size. So if your site is slow, this is the first place to fix. The good part is that you do not need deep technical SEO knowledge to improve this.
Use Modern Image Formats
Old formats like JPEG and PNG are heavy. Switch to:
WebP: Smaller size with the same quality. Works on almost all browsers.
AVIF: Even smaller than WebP. Best for maximum compression.
SVG: Use for logos and icons. Very light and scalable.
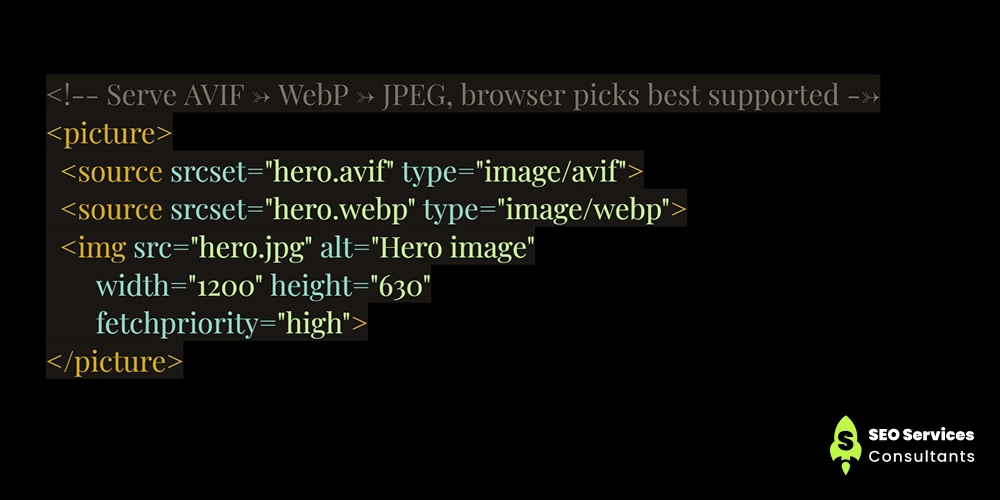
The correct HTML implementation uses the <picture> element to serve the best format the browser supports:
Serve the Right Image Size (srcset and sizes)
Do not load one large image for all devices. Use srcset and sizes so the browser picks the correct image size. Here is the correct implementation:
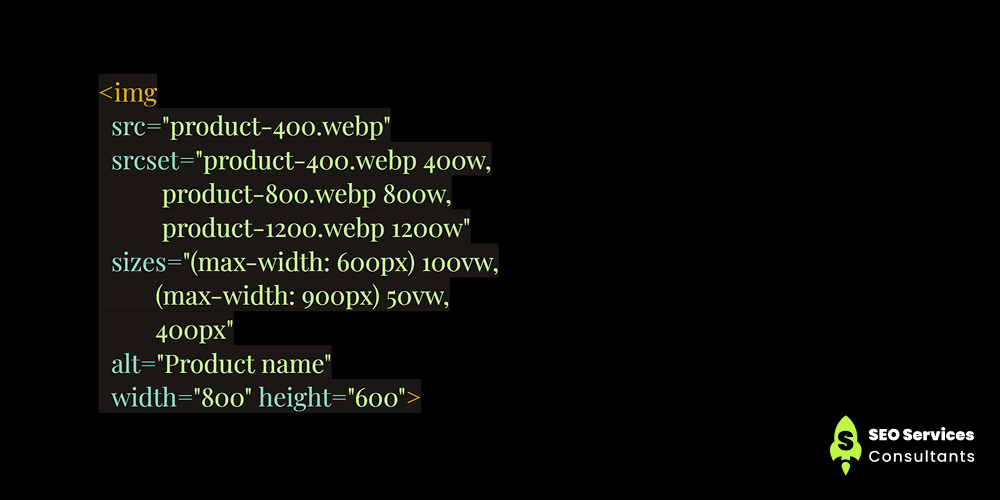
If the size is missing, the browser may load a bigger image than needed. This slows down your site.
Use Lazy Loading Carefully
Lazy loading helps load images only when needed. Use loading=”lazy” for images below the screen.
But avoid one common mistake:
Never lazy-load your LCP image
The LCP image (typically your hero image, above-the-fold product photo, or article featured image) is the metric Google measures. If you lazy-load it, the browser deliberately delays loading it – which directly worsens your LCP score and your Core Web Vitals ranking. Apply loading=”lazy” only to below-the-fold images. For your LCP image, use fetchpriority=”high” instead to tell the browser to load it as a top priority.
Recommended tools by use case
- Squoosh(squoosh.app) — Free, browser-based. Best for converting and compressing individual images. It supports AVIF, WebP, and all modern formats with a visual quality preview.
- ImageOptim— Mac app for bulk lossless compression. Good for a one-time batch optimization pass.
- Cloudinary / Imgix— CDN-based image transformation. Serve the right format, size, and quality automatically based on the requesting device and browser. It is best for sites with large image libraries or user-generated content.
- ShortPixel / Imagify— WordPress plugins that automatically compress and convert images on upload. Set-and-forget solution for WordPress sites.
What this fixes:
Faster load time, better Core Web Vitals, improved SEO, and lower bounce rate.
3. Render Blocking JavaScript and CSS
When your page loads, the browser reads HTML from top to bottom. If it finds <Script> or <link rel=” stylesheet”> files, it pauses everything to download and process them. This delay is called render blocking, and it is a major reason for slow load time and poor LCP scores.
Why this matters
Before showing anything on screen, the browser needs:
- HTML converted into DOM
- CSS converted into CSSOM
- Both are combined into a render tree
JavaScript can change both, so the browser stops rendering until scripts are handled. More blocking means slower first visible content.
Simple fix anyone can apply
Defer Vs Async Vs Module — The Definitive Guide
<script src=”…”>— Default. Blocks HTML parsing completely. Download and execution happen synchronously. Never use for non-critical scripts.
<script defer src=”…”>— Downloads in parallel with HTML parsing but executes only after parsing completes, in document order. Use for scripts that depend on the DOM or each other (analytics, most plugins).
<script async src=”…”>— Downloads in parallel and executes as soon as it’s ready, interrupting HTML parsing. Execution order is not guaranteed. Use for fully independent scripts (ads, social widgets) where order doesn’t matter.
<script type=”module”>— Deferred by default, supports ES module imports, always runs in strict mode. Use for modern JavaScript that uses import/export syntax
Practical rule
Move all <script> tags to just before </body>, or add defer to scripts in the <head>. Never place blocking scripts in the <head> without defer or async — this is the single most impactful render-blocking fix available.
Reduce file size
Minify your CSS and JavaScript. This removes extra spaces and reduces file size by up to 40 percent without changing functionality.
Smart loading in 2026
Instead of one large file, split your code by pages or features. Modern browsers can load multiple small files faster.
Remove unused CSS
Most websites load more CSS than needed. Remove unused styles to reduce file size and speed up rendering.
The Chrome Dev Tools coverage trick
Open Chrome DevTools -More tools – Coverage (or press Ctrl+Shift = P) and search coverage. Then click the record button and load your page. The coverage tab shows exactly which percentage of each CSS and JS file is actually used. Any CSS file showing 70%+ unused is a prime target for purging. Use PurgeCSS, UnCSS, or Tailwind’s built-in purging to remove unused styles automatically.
4. Caching Strategy: Browser, Server, and CDN
Caching is not just one setting. It has three layers. Each solves a different problem. If you treat them the same, your site can either show outdated content or stay slow.
- 1. Browser Cache - Stores files on the user’s device using Cache Control and Expires. Best for repeat visitors. No impact on first-time users.
- 2. Server Cache - Stores processed data using tools like Redis or Memcached. Reduces TTFB and speeds up dynamic sites like WordPress.
- 3. CDN Cache - Stores your site on global servers. Delivers content from the nearest location, improving load time worldwide.
Cache Control Basics
These headers control what gets cached and for how long:
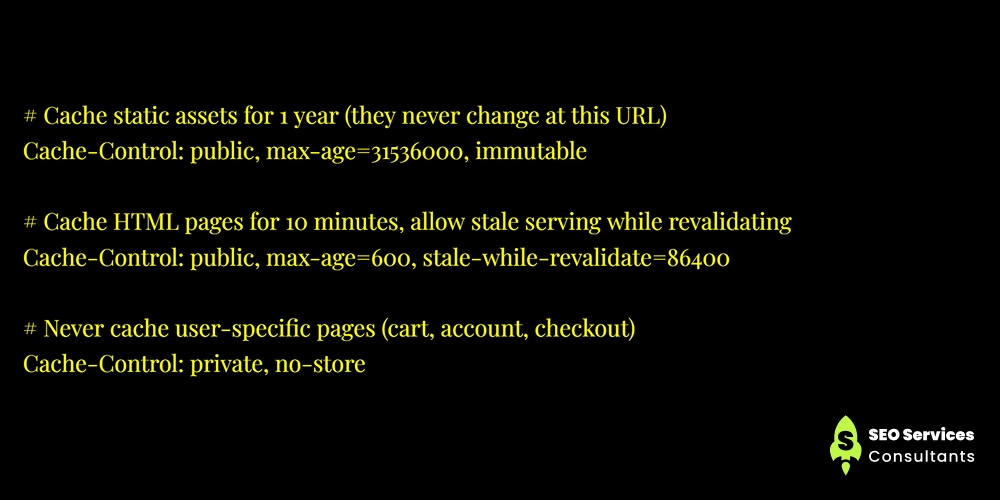
Cache-busting via content hashing
Files like main.js are renamed to main .a3f9c2d.js. When content changes, the file name changes. This allows long caching without showing outdated content.
CDN Options
- Cloudflare - Good starting point. Free plan covers most needs.
- BunnyCDN - Cost-effective for high traffic and media-heavy sites.
- Fastly / Akamai Technologies - Advanced setup for large-scale websites.
Why This Matters
Proper caching improves speed, reduces server load, and boosts conversions.
If your caching is wrong, even a fast server will feel slow.
5. Hidden Tax: Third-party scripts
On the website, having third-party scripts like analytics, live chat, social widgets, ad networks, and A/B testing tools adds extra load to your online store. In this case, you don’t control their code, server, or timing.
Every third-party script adds at least one DNS lookup, one connection, which means the more connection request more delays occur. This directly impacts the speed and user experience.
How to check it
Open Chrome DevTools, then go to the Network tab.
Sort by domains and look for third-party requests
Or run Lighthouse and check
“Reduce the impact of third-party code.”
Focus on:
Main thread time
Transfer size
Number of requests
Why does this matter?
Whenever you are going to add a script, ask this question: What does this cost? Here we are trying to showcase what happens after integrating the tool.
A single chat widget can hinder the path of the main thread for 300 to 800 ms.
Analytics tools can add 200 to 400 KB of JavaScript
A testing tool can delay your LCP by 300 to 600 ms
All in all, compare the cost; if the business value doesn’t justify it, just remove it.
Fix slow-loading elements with a smart technique: use facades for heavy embeds
This is a smart optimization, often overlooked even in 2026. A facade is a lightweight placeholder that delays loading heavy embeds until the user interacts with them.
Instead of loading elements like YouTube, maps, or chat widgets immediately, you show a simple preview (such as an image or thumbnail). The actual content loads only when the user clicks.
This reduces initial page load time and improves performance without removing functionality.
Results: no extra load until needed.
Quick technical wins
Self-host fonts to remove extra DNS and connection delays
Use font-display: swap to keep text visible
Preload important fonts using <link rel=”preload”>
For important third-party scripts, use:
<link rel=”preconnect”>
For less important ones, use:
<link rel=”dns-prefetch”>
6. INS optimization - making your site feel fast to use
(INP) Interaction to the next point is now one of the most important speed metrics after Google’s important ranking signal replaced FID in March 2024.
It measures how quickly your page visually responds after the user interacts while clicking, typing, or interacting with something.
A site can load fast but still feel slow if interactions lag. That is why INP matters more than just page load speed.
The main causes of poor INP
Long tasks blocking the main thread: any JavaScript task running longer than 50 ms is a’ long task”. It blocks the browser from processing user input until it finishes
Heavy event handlers – If a button click runs heavy calculations, updates a lot of page elements, and makes an API call, all at the same time, it blocks the browser.
Layout threshing: When you keep reading and changing element size in a loop (like checking width and then setting it again), the browser has to recalculate the layout every time. This makes your website slow.
Too much third-party JavaScript executing on interaction: Analytics events, ad tracking pixels triggered on click, adds hundreds of milliseconds to interaction response time.
How to fix it
- Break long tasks into smaller chunks using setTimeout or scheduler.postTask()
- Reduce heavy JavaScript on click events
- Avoid repeated DOM updates inside loops
- Limit third-party scripts on interaction
- For React sites, use startTransition() in React 18 for smoother updates
Visual Stability (CLS): Stop your page from jumping
CLS (Cumulative Layout Shift) measures how much your page moves while loading.
If text suddenly shifts or a button moves while you click, that is CLS. A stable page feels smooth. A jumping page loses users.
Common causes of CLS and how to fix them
Images and videos without size – The browser does not know how much space to keep.
Fix: Add width and height in every <img> tag.
Ads or iframes without reserved space – They load later and push content down.
Fix: Set a fixed or minimum height for ad containers.
Content added after page load – Popups, banners, or cookie notices shift content.
Fix: Reserve space or place them at the bottom.
Font loading issues (FOUT) – Text changes style after loading and shifts layout.
Fix: Use font-display: optional or match font sizes properly.
Wrong CSS animations – Using top, left, or margin causes layout shifts.
Fix: Use transform and opacity.
Late loading sections – Cards or content load bigger than expected.
Fix: Keep the placeholder (skeleton) size the same as the final content.
Simple modern fix for images
Use aspect-ratio in CSS so space is reserved before the image loads.
This prevents layout shifts completely for images.
Font display quick guide
font-display: swap → fast text, small layout shift
font-display: optional → no shift, but font may not load
font-display: block → invisible text, avoid using it
How To Check Platform-specific speed checklists?
WordPress Speed Checklist (2026)
WordPress runs 43% of websites, but default setups are often slow. Focus on these first:
- Use managed WordPress hosting for better performance. Kinsta, WP Engine, or Cloudways
- Install a caching plugin and enable all caching layers.
- Choose a lightweight theme to reduce CSS and JavaScript load.
- Remove unused plugins to reduce server and script load.
- Self-host fonts to avoid external requests.
- Clean your database regularly to keep queries fast.
- Optimize and compress images before or during upload.
Shopify and E-commerce Checklist
Speed issues usually come from apps and images:
- Audit all installed apps to reduce unnecessary JavaScript.
- Choose a performance-optimized theme.
- Resize and compress product images to web-friendly sizes.
- Enable lazy loading for product and collection images.
- Remove or defer noncritical third-party scripts.
React / Next.js Speed Tips
- Use dynamic imports to load code only when needed.
- Choose the right rendering method for each page.
- Use startTransition to keep the interface smooth.
- Prefetch links to improve navigation speed.
Advanced Techniques That Actually Make Your Site Feel Fast
These techniques go beyond basic optimization. They improve both real speed and how fast your site feels to users.
1. Speculation Rules API (Instant page loading)
This feature lets the browser load pages before the user clicks.
When the user clicks, the page appears instantly because it is already ready in the background.
For developers, this is done using the Speculation Rules API with prerender settings. Start with the moderate mode so you do not waste resources.
Why it matters: Users feel zero delay when navigating.
2. Priority Hints (Improve LCP quickly)
Not all resources are equally important.
With fetchpriority, you tell the browser what to load first.
Set your main image (LCP element) to high priority
Set scripts like analytics to low priority
Why it matters: Faster loading of key content improves LCP and user experience.
3. Edge Computing (Reduce server delay)
Instead of loading your site from one distant server, edge computing delivers it from a nearby location.
Tools like Cloudflare and Vercel process requests closer to the user.
Why it matters: Lower TTFB and faster response times globally.
4. View Transitions API (Make speed feel faster)
Speed is not only about numbers. It is also about perception.
With the View Transitions API, page changes feel smooth instead of abrupt.
Even if load time is slightly higher, users feel the site is faster.
Why it matters: Better user experience and higher engagement.
Your 30-day action plan
Week 1
Diagnose & fix images
- Run full diagnostic (PSI, GTmetrix, WebPageTest)
- Record baseline scorecard
- Convert all images to WebP/AVIF
- Add width/height to all img tags
- Add fetchpriority="high" to the LCP image
- Remove lazy-load from above-fold images
Week 2
Caching & hosting
- Enable server-side full-page caching
- Set Cache-Control headers for static assets
- Enable CDN (Cloudflare free tier if nothing else)
- Self-host fonts, remove Google Fonts link
- Evaluate hosting upgrade if TTFB > 600ms
Week 3
Scripts & third parties
- Add defer/async to all non-critical scripts
- Audit third-party scripts, remove unused ones
- Add preconnect for the remaining third parties
- Implement a facade for YouTube embeds
- Audit unused CSS with the Coverage tab
Week 4
Advanced & monitoring
- Investigate and fix INP issues
- Review CLS and fix layout-shifting elements
- Add Speculation Rules to high-traffic pages
- Set up Lighthouse CI in your pipeline
- Configure Search Console CWV alerts
- Re-measure and document improvements
Final Says!
Website speed is not a project with an end date. It’s a continuous practice. Every new feature, plugin, or image is a potential regression. The teams that maintain fast sites are those who treat performance as a continuous discipline—with monitoring, budgets, and a quarterly review habit—not a one-time sprint. The work you do this month will drift without maintenance. Build the systems, not just the fixes.